A measurement tool: the tourism function index
Why a new measurement index?
A measurement tool: the tourism function index.
In order to be able to have a measure corresponding to the impact of tourism in the territories, we are going to have fun creating a new indicator which we will call the tourist function index of the territory.
Tourist pressure is not the same throughout the territory. It evolves according to the context, the relief, its natural heritage and its capacity to welcome tourists.
The capacity in commercial or non-commercial beds is not enough to understand the tourist potential of the destination. It must be weighed against the number of inhabitants to define the pressure it exerts during the high season. This index also demonstrates its ability to be an economic and social mono-sector when the index is much higher than the base 1 defined in its calculation. In the opposite case, it proves that the sector is then secondary. Tourism is in this case, a simple economic vector like the others but is less likely to impact the economy of a “country” and the households it composes.
TOURIST FUNCTION INDEX OF A TERRITORY =
NUMBER OF TOURIST BEDS (MERCHANT AND NON-MERCHANT)
/ NUMBER OF INHABITANTS

To explain the concept of the tourist function, it suffices to imagine the pressure that tourist activity can put on a local population. The idea is to be able to measure the possibility of overtourism.
Of course the result is also subject to interpretation but the principle is simple, with an index base of 1, we can show the quantified pressure of tourist activity. For a result of 1, the territory receives as many people as it has permanent population. It is generally the acceptability threshold that the territories define. Sometimes that figure is lower (read New Zealand’s rulings on its hosting capacity) – 35% of New Zealanders believe that ‘international visitors put too much pressure’ on the country, down from 18% in December 2015 A large majority of the population, however, supports this part of the economy. –
However, the index is less than 1. This means that the acceptability threshold varies according to the territories.
If the index exceeds 1, this indicates that for 1 permanent inhabitant we have more than one tourist who comes to its territory. It is therefore important to take into account its multiplier factor to develop the needs of the territory (water networks, energy, parking, etc.)
And conversely, if the index is less than 1, tourist activity is under control or is not a major element in the economy of the country being measured.
SOUTH REGION PROVENCE ALPS CÔTE D’AZUR
A measurement tool: the tourism function index.
Indice de fonction touristique par département
Région Sud Provence Alpes Côte d’Azur
No Data Found
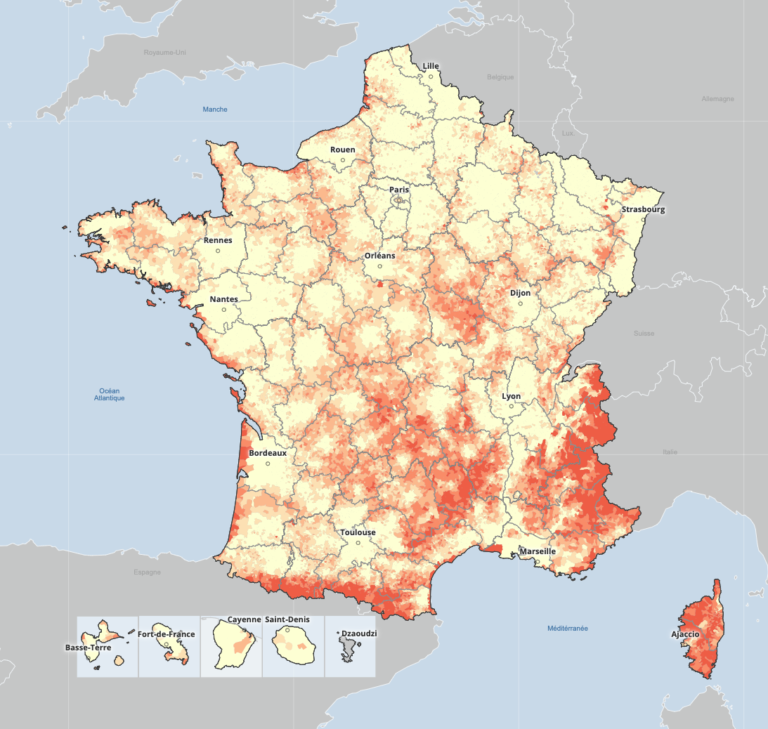
We can immediately identify in the analysis of the Provence-Alpes-Côte d’Azur region the imbalance that tourism creates in several departments. The Var and the Alpes Maritimes are doubling their capacity to produce tourist value in relation to their permanent populations. On the contrary, Bouches-du-Rhône and Vaucluse are stable, the first because of its high population, the second because the tourist sites are less developed than in the rest of the region. Finally, the departments of Alpes-de-Haute-Provence and Hautes-Alpes are well above the basic index. They are totally dependent on their own tourist activity, whether economically or socially.
AUVERGNE RHÔNE ALPES REGION
A measurement tool: the tourism function index.
Indice de fonction touristique par département
Région Auvergne Rhône Alpes
No Data Found
Without commenting on all the results by department, the Auvergne Rhône Alpes region does not know, at the departmental level, oversized figures. Of course, Ardèche and Savoie are beyond a point of equilibrium, but the presence of strong permanent living areas counterbalances tourist activity. the notion of overtourism is therefore to be sought at the valley level rather than at the departmental level.
ILE-DE-FRANCE REGION
A measurement tool: the tourism function index.
Indice de fonction touristique par département
Région Île de France
No Data Found
In the Île-de-France region, Paris is obviously above the other departments with an index of 0.80. Therefore, for 1 intramural inhabitant, there are 0.8 tourists present. The Yvelines follow in stride with a fleet of non-market beds which inflates the figure. The other departments have a fairly low tourism function index due to a very high permanent population density.
At the scale of a destination
Perhaps because the example of the departments was not always obvious, we wanted to go down to the scale of destinations. We have selected a few of them to demonstrate the ability of the tourism function index to give meaning to the capacity to accommodate a territory.
| Lacanau | Val d’Isère | Briançon | Anglet | Saint Jean de Monts | |
| Number of inhabitants (INSEE) | 5 142 | 1 629 | 11 659 | 38 724 | 8 922 |
| Number of overnight stays in 2019 | – | – | – | – | – |
| % Secondary residents (INSEE) | 71,50% | 87,80% | 33,30% | 41,60% | 66,40% |
| Number of secondary residents (INSEE Departments) | 3 677 | 1 430 | 3 882 | 16 109 | 5 924 |
| merchant beds | 25 384 | 8 546 | 4 829 | 8 373 | 64 881 |
| Non-market beds | 11 226 | 25 610 | 6 318 | 61 215 | 70 380 |
| Total tourist beds | 36 610 | 34 156 | 11 147 | 69 588 | 135 261 |
| Tourism function index | 7,1 | 21,0 | 1,0 | 1,8 | 15,2 |
The results are more obvious, we can immediately see that in Val d’Isère and Saint-Jean de Monts, tourist activity clearly structures the destinations. It is therefore necessary to imagine that everything must take this into account in the management of the networks and its communication channels at the height of the season. Lacanau also has a very strong index due mainly to its low permanent local population.
Anglet and Briançon are much more moderate because, on the contrary, the inhabitants counterbalance the tourist activity. We must not forget that for 1 inhabitant, we have 1 tourist in Briançon and 1.8 in Anglet.
So ? Are you convinced by our new indicator? Do you find it useful?
Do not hesitate to comment on this article to develop the reflection around this index.
The Alps agency accompanies throughout the year a good number of territories in their strategies or their reflections that make the difference. Do you want to know our references? Contact us
You wish to organize a conference on this theme, contact us too, we will analyze your needs together.
You can read all the other articles of the Alps Agency in the Blog section and discover all the services we can offer you.
This article was written by François Veauleger


